Search Preference Menu Immediately Increases Google Competitors’ Market Share by 300-800%
New research shows pent-up consumer demand for search alternatives.
This is the first in a series of posts about search preference menus.
A search preference menu — one that changes all search defaults and includes most common Google alternatives — can deliver meaningful search engine choice to consumers and significantly increase competition in the search market.
A search preference menu recently shifted Android market share in Russia, and we wanted to see what could happen in the US, Europe, and Australia. So, we conducted research to find out.
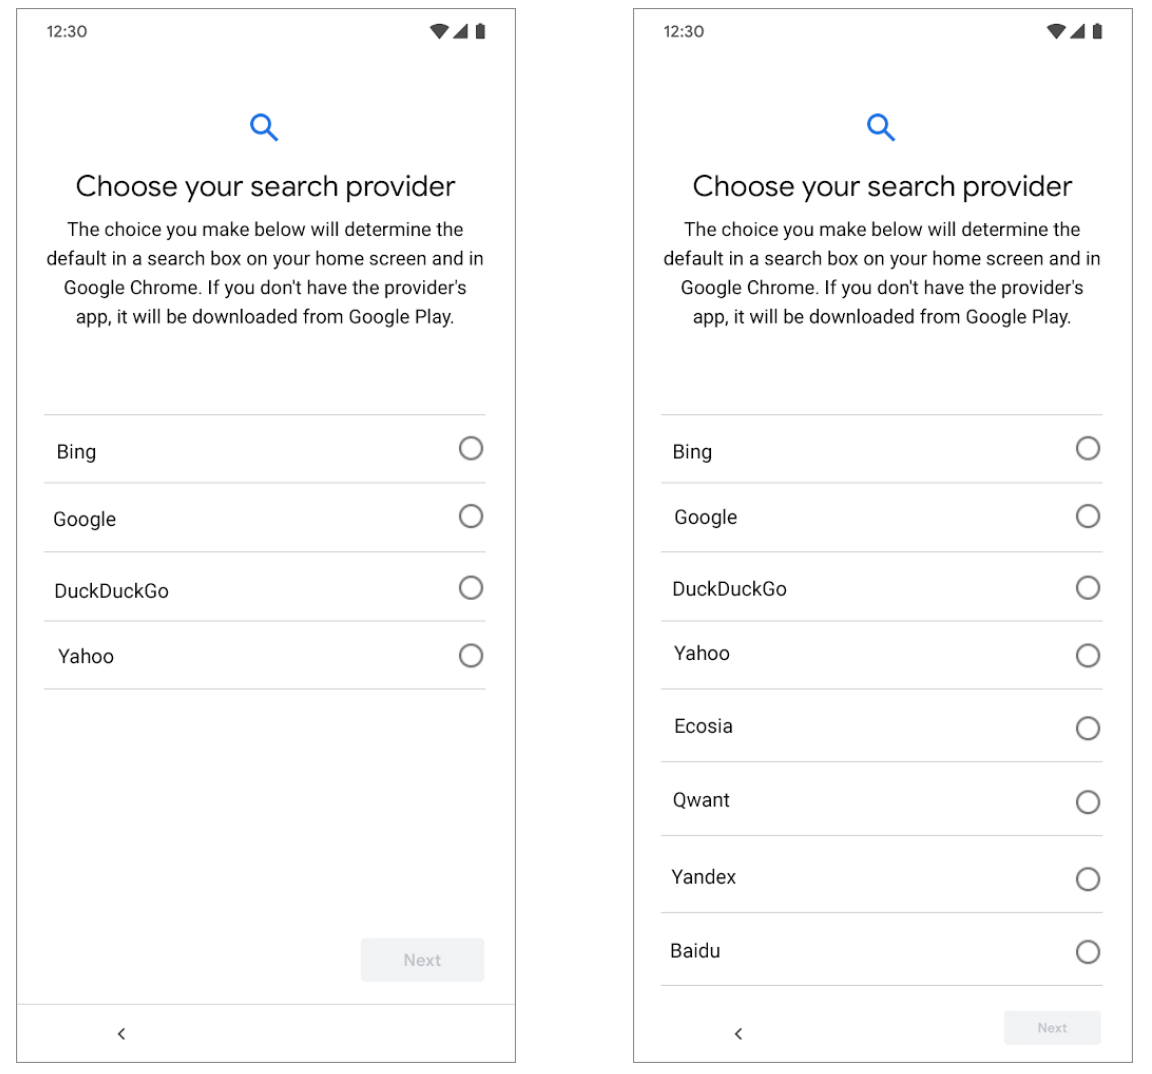
We presented people with the preference menu depicted below (Google's initial "4-choice screen" Android proposal). It lists the top four mobile search engines in these regions (Google, Bing, Yahoo, and DuckDuckGo). We also presented people with an 8-choice variation based on the same design. (This preference menu design is flawed and restrains user choice; we nonetheless used this design for research purposes because it is what Google intended to use.)
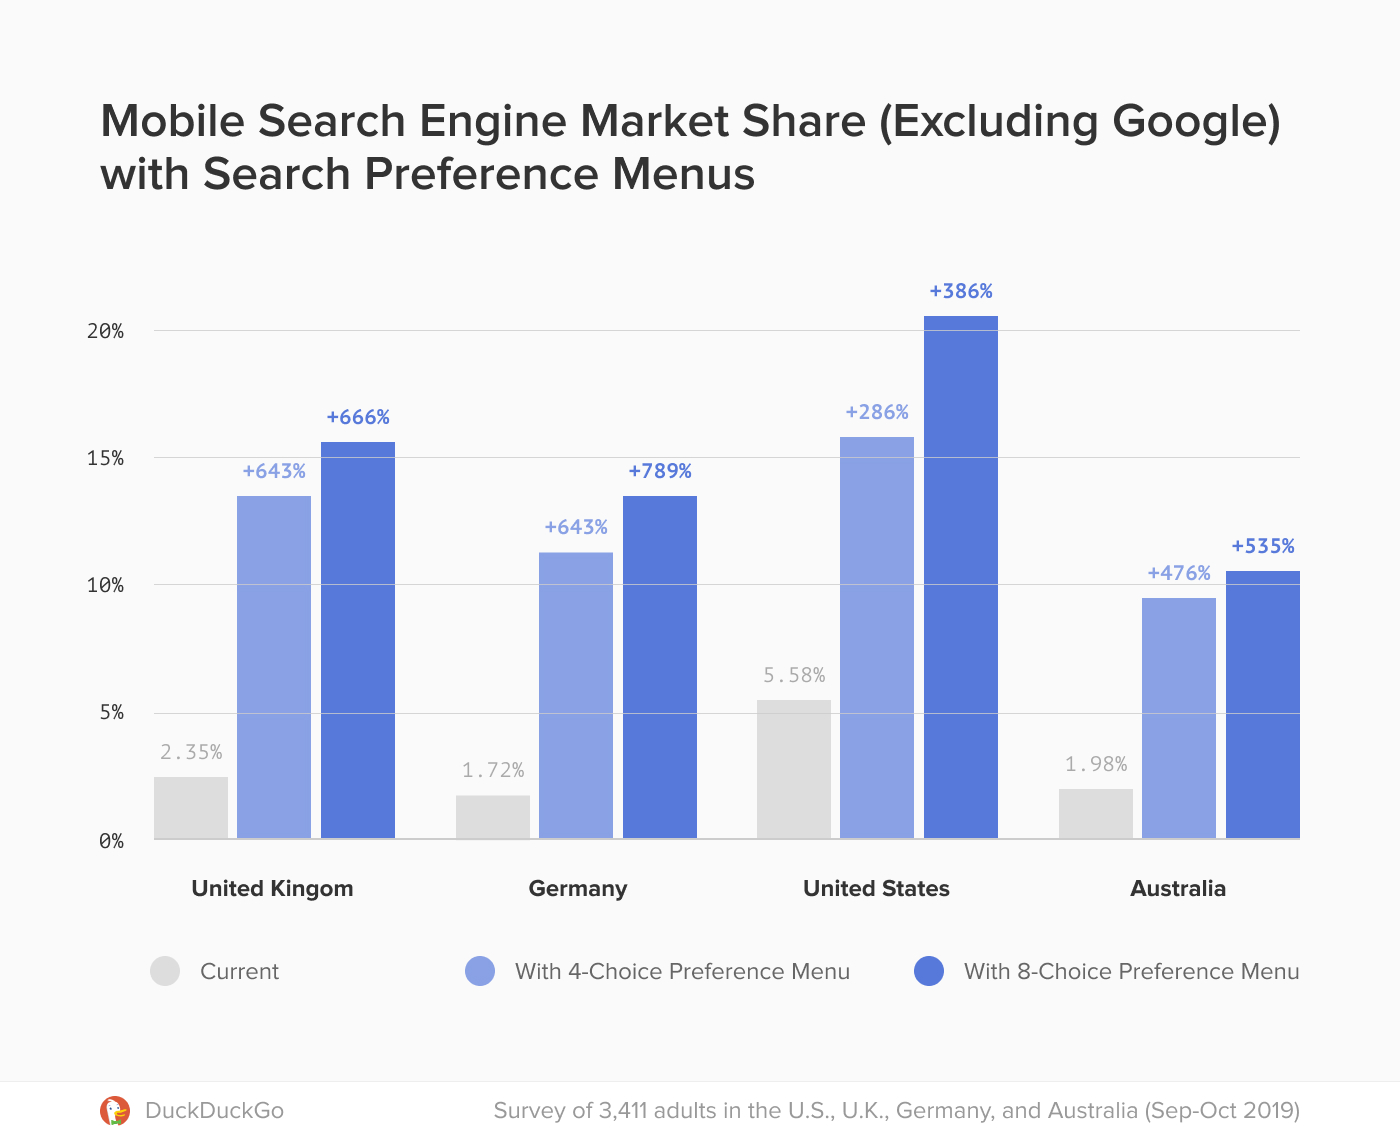
We found that in each surveyed country, people select the Google alternatives at a rate that could increase their collective mobile market share by 300%-800%, with overall mobile search market share immediately changing by over 10%. (Of course, this is dependent on which search engines are on the search preference menu.)
And, this could just be the start. Because people would finally be able to easily change their Android search defaults, and as people become familiar with search engine alternatives, we expect even greater market share changes as time goes on. Today, many users don't realize they can switch search providers, and those who do attempt to change their Android search defaults face obstacles like hard-to-change homescreen search widgets. Google's pervasiveness in search is difficult to dissipate; the company has many levers that exert magnetic forces, pulling people into its search engine. As a result, a preference menu is just one part of an effective remedy.
Additionally, this increased market share change could be negatively impacted in many ways. For example, if the preference menu is only distributed to new devices, then we expect market share changes to be frustratingly slow. Also other Android features (like Google Assistant), use of other Google products (like Gmail), coupled with Google prompts to users (such as pop-up boxes), could draw people back to using Google search. Finally, research has shown that people rate the same set of search results better when Google's logo is attached to it. For all these reasons, people often need time and repeated uses of non-Google search engines before consistent adoption.
When we presented people with the longer list of search engines, those people selected more non-Google search engines. In other words, more choice means more diverse market share.
In each screen variation that we tested, DuckDuckGo was the #2 selected search engine. We believe this underscores the pent-up consumer demand for a truly private search option. (Of course, to satisfy that demand, a private search option must be on the preference menu.)
To gauge why consumers might select an alternative search engine, we asked people the following question:
A search engine is a web tool in which you enter search terms and receive a list of results from varying websites. Examples include Google.com, Yahoo.com, and Bing.com If you were going to switch to a new search engine, which factor would most motivate you to make the switch? (Or, if you have already switched search engines, what was the primary factor that motivated the switch?)
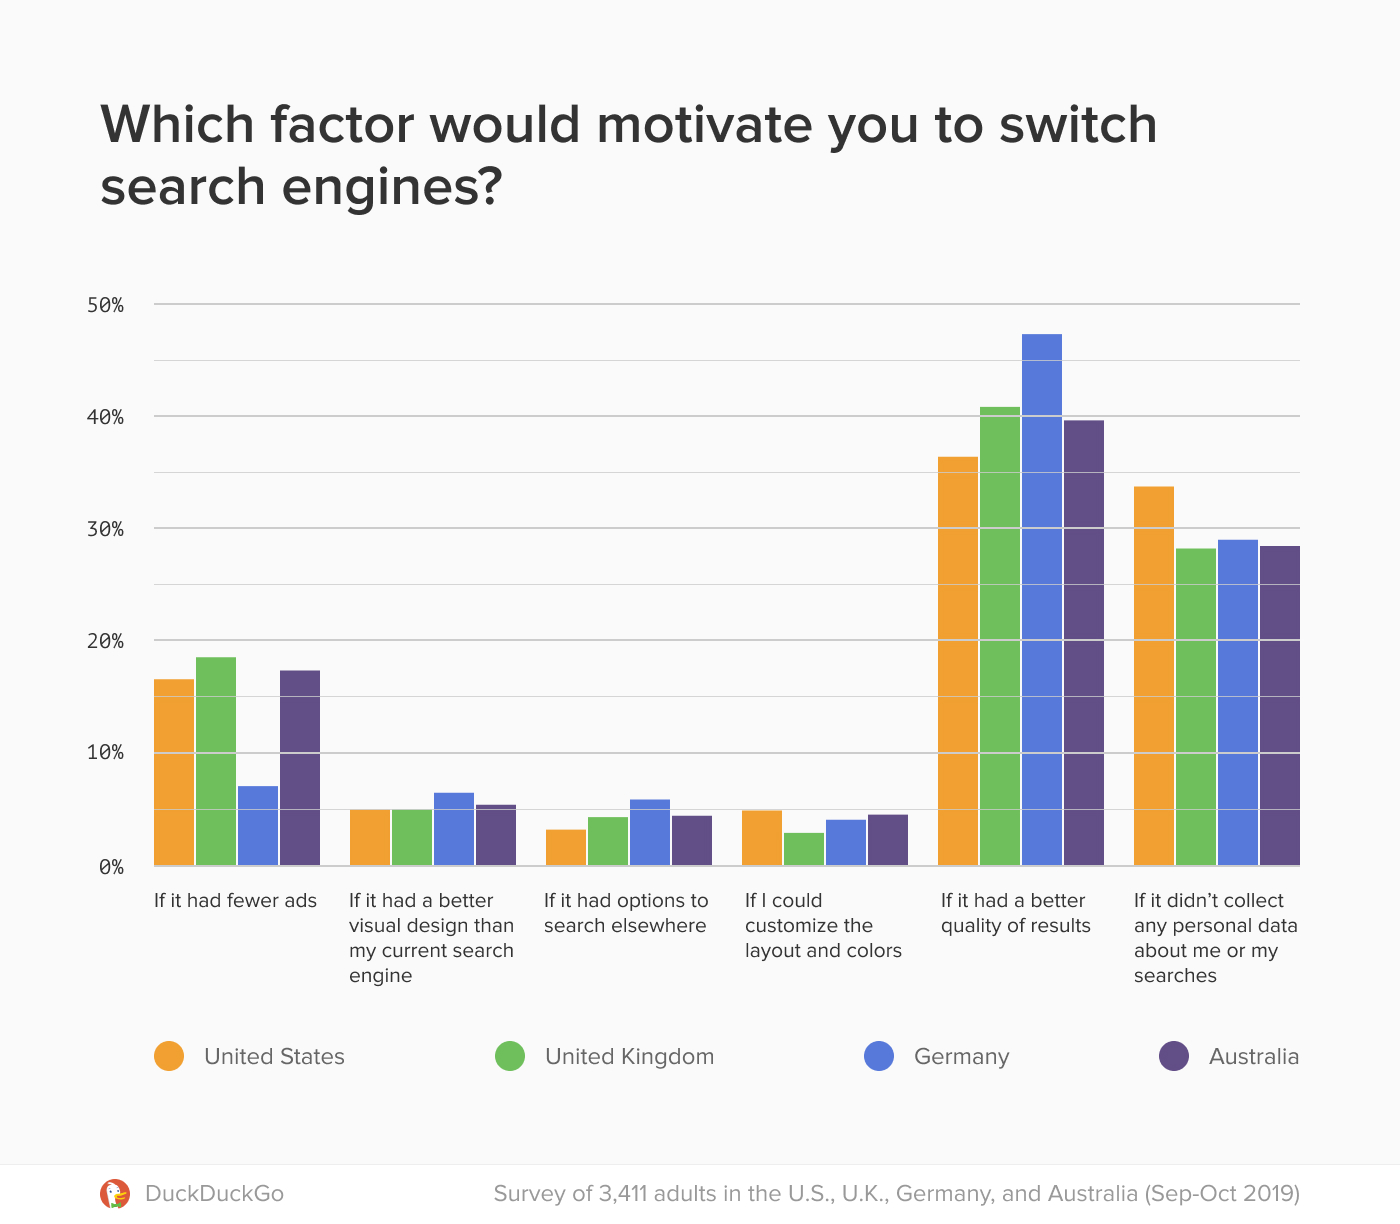
The #1 reason was "If it had a better quality of results", closely followed by "If it didn't collect any personal data about me or my searches", providing more evidence that many consumers would like a truly private search option.
Below is some of the raw data, followed by the underlying methodology. Overall, this data shows strong pent-up consumer demand for search alternatives to Google, but competitors' market share is suppressed by difficulties that users face in changing their search defaults.
Raw Data
| Factor | United States | United Kingdom | Germany | Australia |
|---|---|---|---|---|
| If it had a better quality of results |
36.3% (± 2.74) | 40.72% (± 3.28) | 47.16% (± 5.35) | 39.52% (± 2.98) |
| If it didn't collect any personal data about me or my searches |
33.67% (± 2.7) | 28.19% (± 3.00) | 28.96% (± 4.86) | 28.41% (± 2.75) |
| If it had fewer ads | 16.62% (± 2.13) | 18.56% (± 2.60) | 7.16% (± 2.76) | 17.39% (± 2.31) |
| If it had options to search elsewhere |
3.31% (± 1.02) | 4.41% (± 1.37) | 5.97% (± 2.54) | 4.54% (± 1.27) |
| If it had a better visual design than my current search engine |
5.09% (± 1.25) | 5.1% (± 1.47) | 6.57% (± 2.65) | 5.51% (± 1.39) |
| If I could customize the layout and colors |
5.00% (± 1.24) | 3.02% (± 1.14) | 4.18% (± 2.14) | 4.64% (± 1.28) |
United Kingdom
| Search Engine | Current Mobile Market Share |
Mobile Market Share With Preference Menu |
% Change | Brand Awareness |
|---|---|---|---|---|
| Total Competition |
2.09% | 13.43% | +643% | n/a |
| 97.62% | 86.57% (± 2.89) | -11% | 96.64% (± 1.20) | |
| Yahoo | 1.05% | 4.29% (± 1.72) | +409% | 92.23% (± 1.79) |
| Bing | 0.55% | 3.36% (± 1.53) | +611% | 82.37% (± 2.54) |
| DuckDuckGo | 0.49% | 5.78% (± 1.98) | +1,180% | 21.00% (± 2.72) |
| Search Engine | Current Mobile Market Share |
Mobile Market Share With Preference Menu |
% Change | Brand Awareness |
|---|---|---|---|---|
| Total Competition |
2.35% | 15.66% | +666% | n/a |
| 97.62% | 84.33% (± 3.08) | -14% | 96.64% (± 1.20) | |
| Yahoo | 1.05% | 3.73% (± 1.6) | +355% | 92.23% (± 1.79) |
| Bing | 0.55% | 3.54% (± 1.57) | +644% | 82.37% (± 2.54) |
| DuckDuckGo | 0.49% | 4.85% (± 1.82) | +990% | 21.00% (± 2.72) |
| Ecosia | 0.21% | 2.24% (± 1.25) | +1,067% | 7.77% (± 1.79) |
| Yandex | 0.01% | 0.37% (± 0.52) | n/a | 4.41% (± 1.37) |
| Qwant | 0.00% | 0.37% (± 0.52) | n/a | 1.74% (± 0.87) |
| Baidu | 0.04% | 0.56% (± 0.63) | n/a | 6.38% (± 1.63) |
United States
| Search Engine | Current Mobile Market Share |
Mobile Market Share With Preference Menu |
% Change | Brand Awareness |
|---|---|---|---|---|
| Total Competition |
5.58% | 15.95% | +286% | n/a |
| 94.26% | 84.04% (± 2.85) | -11% | 96.44% (± 1.06) | |
| Yahoo | 2.73% | 3.79% (± 1.49) | +139% | 92.88% (± 1.47) |
| Bing | 1.71% | 4.74% (± 1.66) | +277% | 86.60% (± 1.94) |
| DuckDuckGo | 1.14% | 7.42% (± 2.04) | +651% | 28.67% (± 2.58) |
Australia
| Search Engine | Current Mobile Market Share |
Mobile Market Share With Preference Menu |
% Change | Brand Awareness |
|---|---|---|---|---|
| Total Competition |
1.98% | 9.43% | +476% | n/a |
| 97.95% | 90.56% (± 2.33) | -8% | 96.14% (± 1.17) | |
| Yahoo | 0.73% | 2.81% (± 1.32) | +384% | 88.12% (± 1.97) |
| Bing | 0.48% | 2.15% (± 1.16) | +446% | 77.10% (± 2.56) |
| DuckDuckGo | 0.57% | 4.47% (± 1.65) | +784% | 15.27% (± 2.19) |
Germany
Search Engine | Current Mobile
Market Share | Mobile Market Share
With Preference Menu | % Change | Brand Awareness
--- | --- | --- | --- | --- | --- |
Total
Competition | 1.72% | 13.57% | +789% | n/a
Google | 98.24% | 80.85% (± 5.03) | -18% | 94.93% (± 2.35)
Yahoo | 0.32% | 3.4% (± 2.32) | +1,063% | 77.31% (± 4.48)
Bing | 0.44% | 2.98% (± 2.17) | +677% | 67.76% (± 5.01)
DuckDuckGo | 0.37% | 5.96% (± 3.03) | +1,610% | 28.96% (± 4.86)
Ecosia | 0.45% | 4.26% (± 2.58) | +946% | 13.73% (± 3.69)
Yandex | 0.12% | 1.28% (± 1.44) | +1,066% | 7.76% (± 2.87)
Qwant | 0.01% | 0.85% (± 1.17) | n/a | 4.18% (± 2.14)
Baidu | 0.01% | 0.43% (± 0.83) | n/a | 11.34% (± 3.4)
Methodology
These results are based on surveys via SurveyMonkey’s “Audience” platform, which ensures the demographic make-up of respondents is representative of the respective national population. Survey respondents were paid and a confidence level of 95% was used for calculating the values above. Answers were randomized.
- An October 2019 survey of 1,179 adults (18+) in the U.S.
- A September 2019 survey of of 862 adults (18+) in the U.K.
- A September 2019 survey of of 335 adults (18+) in Germany.
- An October 2019 survey of 1,035 adults (18+) in Australia.
Relevant survey questions not quoted above:
- "Brand Awareness" was measured with this question: "Which of the following brands have you heard of? (Select all that apply.)"
- The preference menus were measured with this question: "Please read the screen carefully and select which search provider you would choose."
We included other questions in our surveys. If you'd like to discuss our research results, please reach out.
For more privacy advice follow us on Twitter, and stay protected and informed with our privacy newsletters.